Business Wire08.02.16
Orthofix International N.V. today (1 Aug) reported its financial results for the second quarter ended June 30, 2016. For the second quarter of 2016, net sales were $104.1 million, loss per share from continuing operations was ($0.35) and adjusted earnings per diluted share from continuing operations was $0.41.
“Our second quarter continued to demonstrate solid and consistent performance both in our financial results as well as our operational improvements. A key driver of this performance was, once again, outstanding execution by our BioStim strategic business unit. Additionally, we continue to make steady progress in achieving our margin expansion and ROIC objectives,” said Brad Mason, president and CEO.
Second Quarter Financial Results
The following table provides net sales, net sales change and constant currency net sales change by strategic business unit (“SBU”) for the three months ended June 30, 2016 and 2015:
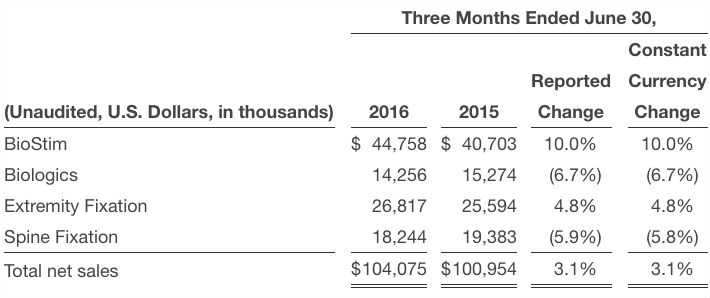
The growth in the BioStim SBU was primarily driven by increased order counts from an expanding customer base and our order to cash process improvements that increased the overall percentage that we collect on orders and therefore increased net sales. The decrease in the Biologics SBU was primarily due to the exclusion from a large national hospital account and additional competing product offerings. The increase in net sales in the Extremity Fixation SBU was largely due to growth in the U.S. as a result of the increased adoption of our TrueLok Hexapod System (“TL-HEX™”) and the addition of new distributors. The decrease in net sales in the Spine Fixation SBU was primarily due to the loss of several key surgeon customers in the U.S., the timing of international cash collections and the exclusion from a large national hospital account. Gross profit increased $2.5 million to $81.6 million. Gross margin slightly increased to 78.4% as compared to 78.3% in the prior year period.
Net margin (gross profit less sales and marketing expenses) was $35.5 million, a decrease of 1.6% compared to $36.1 million in the prior year period. This decline was driven by an increase in sales and marketing expenses, offset by the improvement in gross profit. The increase in sales and marketing expenses was primarily driven by lower than usual sales and marketing expenses in the prior year period due to the restructuring of the U.S. Extremity Fixation sales management organization.
Operating expenses increased by $10.1 million to $84.2 million, compared to $74.1 million in the prior year period. This increase was driven by charges of $12.9 million relating to our ongoing settlement discussions with the Division of Enforcement of the Securities and Exchange Commission (the “SEC”) related to the SEC’s investigation of (1) our prior accounting review and restatements of financial statements and (2) allegations of improper payments with respect to our Brazil-based subsidiary, as further discussed in our Form 10-Q for the second quarter ended June 30, 2016, and the increase in sales and marketing expenses, offset by decreases in general and administrative expenses and restatement and related costs. The decrease in general and administrative expenses was driven by decreased professional and consulting fees, and a legal judgment incurred in the prior year.
Operating loss was $2.6 million compared to operating income of $4.9 million in the prior year period.
Net loss from continuing operations was $6.3 million, or ($0.35) per share, compared to net income of $4.1 million, or $0.21 per diluted share in the prior year period.
Adjusted net income from continuing operations was $7.5 million, or $0.41 per diluted share, compared to adjusted net income of $6.3 million, or $0.33 per diluted share in the prior year period.
EBITDA was $2.6 million, compared to $11.0 million in the prior year period. Adjusted EBITDA, which excludes share-based compensation, foreign exchange impact, strategic investments, restatements and related costs, infrastructure investments, legal judgments, gain on sale of assets, and charges related to U.S. Government resolutions, increased to $19.2 million or 18.5% of net sales for the second quarter, compared to $17.2 million or 17.1% of net sales in the prior year period.
As of June 30, 2016, cash and cash equivalents were $40.5 million compared to $63.7 million as of December 31, 2015. This change was primarily driven by share repurchases, offset by an increase in operating cash flows. As of June 30, 2016 the Company had no outstanding indebtedness and borrowing capacity of $125 million.
Share Repurchase Plan
As previously announced, the Company initiated a share repurchase plan in the fourth quarter of 2015 of up to $75 million of the Company’s common stock through the end of September 2017. As of June 30, 2016, the Company had repurchased a cumulative total of approximately 1,374,000 shares of common stock for $55.5 million under this plan, of which approximately 404,000 shares of common stock were repurchased for $17.4 million in the second quarter of 2016.
Fiscal 2016 Outlook
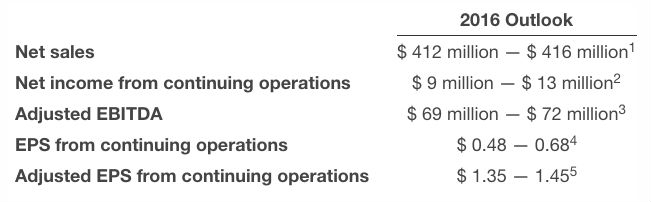
For the fiscal year ending December 31, 2016, the Company expects the following results, assuming exchange rates are the same as those currently prevailing.
References
1Represents a year-over-year increase of 3.9% to 4.9% on a reported basis.
2Represents a year-over-year increase of approximately $11 million to $15 million on a reported basis.
3Represents a year-over-year increase of 13.7% to 18.6%. For additional detail, refer to the reconciliation of Adjusted EBITDA to Net Income included within the Selected Financial Data.
4Represents a year-over-year increase of approximately $0.60 to $0.80 per share using 18,700,000 to 18,500,000 shares outstanding for 2016, respectively.
5Represents a year-over-year increase of 70.9% to 83.5% using 18,700,000 to 18,500,000 shares outstanding for 2016, respectively. For additional detail, refer to the reconciliation of Adjusted EPS from continuing operations to EPS from continuing operations included within the Selected Financial Data.
“Our second quarter continued to demonstrate solid and consistent performance both in our financial results as well as our operational improvements. A key driver of this performance was, once again, outstanding execution by our BioStim strategic business unit. Additionally, we continue to make steady progress in achieving our margin expansion and ROIC objectives,” said Brad Mason, president and CEO.
Second Quarter Financial Results
The following table provides net sales, net sales change and constant currency net sales change by strategic business unit (“SBU”) for the three months ended June 30, 2016 and 2015:
The growth in the BioStim SBU was primarily driven by increased order counts from an expanding customer base and our order to cash process improvements that increased the overall percentage that we collect on orders and therefore increased net sales. The decrease in the Biologics SBU was primarily due to the exclusion from a large national hospital account and additional competing product offerings. The increase in net sales in the Extremity Fixation SBU was largely due to growth in the U.S. as a result of the increased adoption of our TrueLok Hexapod System (“TL-HEX™”) and the addition of new distributors. The decrease in net sales in the Spine Fixation SBU was primarily due to the loss of several key surgeon customers in the U.S., the timing of international cash collections and the exclusion from a large national hospital account. Gross profit increased $2.5 million to $81.6 million. Gross margin slightly increased to 78.4% as compared to 78.3% in the prior year period.
Net margin (gross profit less sales and marketing expenses) was $35.5 million, a decrease of 1.6% compared to $36.1 million in the prior year period. This decline was driven by an increase in sales and marketing expenses, offset by the improvement in gross profit. The increase in sales and marketing expenses was primarily driven by lower than usual sales and marketing expenses in the prior year period due to the restructuring of the U.S. Extremity Fixation sales management organization.
Operating expenses increased by $10.1 million to $84.2 million, compared to $74.1 million in the prior year period. This increase was driven by charges of $12.9 million relating to our ongoing settlement discussions with the Division of Enforcement of the Securities and Exchange Commission (the “SEC”) related to the SEC’s investigation of (1) our prior accounting review and restatements of financial statements and (2) allegations of improper payments with respect to our Brazil-based subsidiary, as further discussed in our Form 10-Q for the second quarter ended June 30, 2016, and the increase in sales and marketing expenses, offset by decreases in general and administrative expenses and restatement and related costs. The decrease in general and administrative expenses was driven by decreased professional and consulting fees, and a legal judgment incurred in the prior year.
Operating loss was $2.6 million compared to operating income of $4.9 million in the prior year period.
Net loss from continuing operations was $6.3 million, or ($0.35) per share, compared to net income of $4.1 million, or $0.21 per diluted share in the prior year period.
Adjusted net income from continuing operations was $7.5 million, or $0.41 per diluted share, compared to adjusted net income of $6.3 million, or $0.33 per diluted share in the prior year period.
EBITDA was $2.6 million, compared to $11.0 million in the prior year period. Adjusted EBITDA, which excludes share-based compensation, foreign exchange impact, strategic investments, restatements and related costs, infrastructure investments, legal judgments, gain on sale of assets, and charges related to U.S. Government resolutions, increased to $19.2 million or 18.5% of net sales for the second quarter, compared to $17.2 million or 17.1% of net sales in the prior year period.
As of June 30, 2016, cash and cash equivalents were $40.5 million compared to $63.7 million as of December 31, 2015. This change was primarily driven by share repurchases, offset by an increase in operating cash flows. As of June 30, 2016 the Company had no outstanding indebtedness and borrowing capacity of $125 million.
Share Repurchase Plan
As previously announced, the Company initiated a share repurchase plan in the fourth quarter of 2015 of up to $75 million of the Company’s common stock through the end of September 2017. As of June 30, 2016, the Company had repurchased a cumulative total of approximately 1,374,000 shares of common stock for $55.5 million under this plan, of which approximately 404,000 shares of common stock were repurchased for $17.4 million in the second quarter of 2016.
Fiscal 2016 Outlook
For the fiscal year ending December 31, 2016, the Company expects the following results, assuming exchange rates are the same as those currently prevailing.
References
1Represents a year-over-year increase of 3.9% to 4.9% on a reported basis.
2Represents a year-over-year increase of approximately $11 million to $15 million on a reported basis.
3Represents a year-over-year increase of 13.7% to 18.6%. For additional detail, refer to the reconciliation of Adjusted EBITDA to Net Income included within the Selected Financial Data.
4Represents a year-over-year increase of approximately $0.60 to $0.80 per share using 18,700,000 to 18,500,000 shares outstanding for 2016, respectively.
5Represents a year-over-year increase of 70.9% to 83.5% using 18,700,000 to 18,500,000 shares outstanding for 2016, respectively. For additional detail, refer to the reconciliation of Adjusted EPS from continuing operations to EPS from continuing operations included within the Selected Financial Data.