05.18.12
U.S. hip and knee implant inpatient procedures increased 3.2 percent between 2009 and 2010 to 1,157,600.1 Knee replacements grew annually at a rate of 3.3 percent to 698,900, and revision knees were up by 5 percent to 67,100. Revision knees outnumbered revision hips in 2010.
Why It’s Important
The impacts of the recession remain with us and the orthopedic sector is a barometer of the lingering effect of the downturn in the medical technology space. According to a survey (n=59) of hospitals by
Orthopedic Network News, the number of knee procedures declined by 2 percent in first quarter of 2011 compared with the same period in 2010. At the top 10 hospitals doing hip and knee implant surgery, the percentage of revision knees to total knee implants varied from 8 percent to 17 percent. Revision procedures also are a key metric because a high revision rate generally indicates that the hospital is a referral center for challenging cases of knee revision. When referrals are up, this may indicate that more patients are financially able to seek care—a cautious indicator that the health of our business is getting better.
Sales Trends
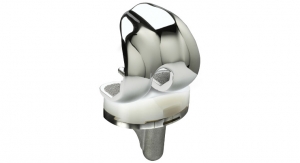
Sales of knee implants contain multiple product segments and are presented in Chart 1. Bicondylar femurs were estimated at 39 percent of sales, tibial components at 22 percent, tibial inserts at 17 percent and patellas at 9 percent. The “other” category includes stems, wedges, and hinged knee components (estimated together at 9 percent) followed by unicondylar knees at 4 percent.2
|
Chart 1: Knee implants by product segment. |
|
Chart 2: Though still lagging behind U.S. volume, European growth numbers are robust. |
U.S. Sales and Pricing Trends
Orthopedic Network News also reported that the mix of knee procedures has not significantly changed, and that in first quarter of 2011, 85 percent of the procedures were uncoated knee implants, 5 percent were unicondylar, 5 percent were bilateral, and overall, 5 percent were revision implants. As compared to prior years, knee replacements saw price increases: primary knees (including unicondylar knees), rose 5.1 percent to $5,324 between 2009 and 2010. Revision knees registered an 18.3 percent increase, to $9,355. Implant costs include metals and plastics, bone cement and accessories, bone grafts and substitutes, freight and loaner fees. These additional materials are estimated at approximately 3 percent of the total implant costs.
European and U.S. Numbers
In the “big five” countries in Europe (France, Germany, Italy, Spain and the United Kingdom), Germany leads the knee replacement market with 199,708 knee implants in 2011.3 The compound annual growth rates in Europe are expected to be robust, reaching 9.4 percent per year until 2015. As in the United States, procedure rates are driven by the aging population. The European Public Health Commission reports that musculoskeletal pain is most frequently reported in health surveys and that total joint replacement (mainly of the hip or knee) is one of the most common elective operations for older people in most European countries.4
Light at the End of the Tunnel?
Persistent economic issues from 2008 still are anticipated, but we expect that our industry, while not recession-proof, will continue to grow. Many indicators, including the recent tidal wave of acquisitions, show that the medtech space is a place where the combination of patient need and innovation will continue to grow the business.
References:
- Millennium Research Group, www.MRG.net
- Orthopedic Network News, www.orthopedicnetworknews.com, Vol. 22, No. 1, July 2011.
- Kalorama Research, European Surgical Procedure Volumes, December 2011.
- http://ec.europa.eu/health/major_chronic_diseases/diseases/musculoskeletal/index_en.htm. Accessed May 1, 2012.
Editor’s note: Readers are invited to submit market data and trend questions to Maria Shepherd. Periodically, selected questions will be presented in this column, with answers from Maria. Send your questions to the email in her bio (below).
Maria Shepherd, founder of Data Decision Group, has 20 years of leadership experience in medical device and life-sciences marketing. Her firm quantitatively and qualitatively sizes opportunities, evaluates new technologies, and assesses prospective acquisitions for medtech companies. She can be reached at (617) 548-9892 or mshepherd@ddecisiongroup.com.