05.18.12
Finding the Best Fit
Anatomical data mining can improve the results for standard implant design.
Human beings are diverse in their physical makeup. Adult humans can range in height from under 4 feet to taller than 7 feet, and weigh less than 100 pounds to more than 500 pounds. Skeletal shapes also can vary tremendously, from outwardly visible differences (for example, varus/valgus deformation of the leg) to subtle differences in their shape (such as femur neck angle or femur head diameter). All this variation presents a challenge to design a well-fitting implant for the mass market. Take the example of a seat in a car. The seat is designed for a “standard person.” In the United States, the average male between 20 and 74 years of age is 5 feet, 9 and half inches tall and weighs 191 pounds.1 Automobile seats for the American market are designed, of course, keeping the average user in mind. Taller or smaller people can make themselves comfortable by making adjustments to the seat’s position—reclining, up or down, backward and forward. However, the further away from “average” a person is, the less optimal the seat is for that person. The same logic can be applied to orthopedic implants. While larger or smaller sizes are provided to address the diversity in the population, it is worth exploring the assumptions made in the design of those implants and the selection of sizes.
Assumptions in Implant Design
While custom or semi-custom implants are now possible with craniomaxillofacial cases, extreme hip replacements and surgical instrumentation, most other orthopedic implants, such as knee or hip reconstructions, plates, nails, etc., still use standard, off-the-shelf implants. Implant designers, therefore, provide various sizes of implants based on some key measurements taken from the literature or a limited sampling of patient data. The different implant sizes often are scaled versions of the average implant, although, in reality, the shape of anatomy changes as a function of the size of the patient. In other words, the average small person is not just a scaled version of the average large person. In the case of knee implants, for example, the sizing of the implant commonly is determined entirely based on a single measurement—the antero-posterior (AP) dimension, with all other dimensions simply scaling with the AP measurement.
The implants are tested by manual fixation in a limited number of cadaver bones and optimized in a trial-and-error process, with feedback from surgeons, to find the optimal shape and position. Since the small set of cadavers does not necessarily describe the diversity in a population, there is a high possibility of a poor fit or even implant failure, especially in patients outside of the design space.
Several studies have now shown that implants designed based on assumptions that hold true for a certain demographic or ethnicity (e.g., male vs. female, Asian vs. European vs. North American), or body type (tall vs. short, lean vs. heavy) may not hold true in others. For example, authors of a recent study about the design of the femoral component in a total knee prosthesis in the Korean population found that the mediolateral (ML) dimension in a Korean population is larger compared with a Caucasian population.2 The study further shows that several implants currently on the Korean market that were designed based on measurements made in a Caucasian population have smaller ML dimensions for a given AP dimension, implying a poor fit (see Figure 2). Generally, some studies have shown that implants designed using data from a certain population may show poor fit and a higher failure rates in others.3
Measurements on populations
Today, with the increasing use of 3-D medical imaging technologies, specifically computed tomography (CT) and magnetic resonance imaging (MRI), combined with parallel developments in the application of advanced statistical methods, it is possible to analyze 3-D patient anatomy to extract features, trends and population-specific shape information. This can be applied to the development of new standard implants targeted to a specific population group, or to improve the shape of existing implants.
At the simplest level, measurements can be made on large numbers of image datasets to obtain a population’s mean dimensions. For example, obtaining the mean AP/ML dimension or the femur head diameter can provide a good starting point for implant design. Measurements that were made in two dimensions using X-ray radiographs about a decade ago now can be made in 3-D based on CT or MRI, with increased accuracy.
Advanced Measurements and Average Models
More advanced measurements such as the curvature of a bone canal, or the best fit sphere on a femur head now can be performed to obtain parameters that will be most suitable for a population. While custom implants are designed specifically for a patient using the patient’s own anatomy, a general implant can be designed using a “population average” model. Such a model can be obtained using hundreds of 3-D images by carefully segmenting out and building 3-D models of the anatomy of interest and defining landmarks to register these 3-D models together. The resultant population “average model” then can be used directly for design, enabling the engineer to design implants that should fit significantly better. (See Figure 3.)
Statistical Models
Advanced statistical techniques can be used to further probe the 3-D datasets. Analysis of the entire geometrical shape is possible using principal component analysis that reduces high dimensional data into models that capture the variance in the dataset.3 The technique works on a vector representation of 3-D models. Mathematical operations on this training data set compress the information into an “average shape” and the principal modes of variance of that shape, i.e. the principal components.
Typically, the entire dataset can be represented by just a few independent modes, the ones that capture most of the inherent variation in the data. This average model, along with the modes of variance, essentially are an active shape model, which then can be analyzed and applied in several ways in the implant design process. For example, the implant can be designed based on the average and then evaluated against the extremes of the population in order to determine how well the implant covers the population.
Figure 4 shows the first mode or principal component, in the analysis of 40 Chinese femurs. The first mode is directly related to the length of the femur, but also captures with it any parameter that correlates with the length. In this case, the most visible correlation is the neck angle, which increases with length.
As with all statistical analyses, care must be taken to ensure that sufficient number of samples is included for the desired statistical power. It also is essential to ensure that the statistical model is indeed representative of the population of interest, by looking for and eliminating any bias in data selection, while removing outliers that may skew the data.
Applications
It is easy to see how specific measurements (angles, lengths, etc.) on a set of 3-D bone models can be useful in developing or optimizing implants. A better starting point for implant design is a statistical bone model, which could be used to optimize the shape, contours and size range of a variety of implants. Implants such as trauma plates or intramedullary nails can be better contoured and bent to follow the anatomy using these statistical bone models, thereby minimizing the amount of reshaping and trimming required during surgery. In addition to better fit, these bone models could lead to an optimized or “smart” sizing, allowing better coverage of the population with fewer sizes of implants.
The advantage of using more advanced statistical analyses resulting in complete 3-D models of averages and deviations, is that it can unravel hidden trends without pre-selection of specific measurements.
For example, a study on a dataset of 40 patients reveals that the femur neck angle has a correlation with length of the femur (See Figure 4). The larger neck angle seen in longer femurs could be a result of the differences in load experienced by the joint between shorter and taller people. By using methods such as principal component analysis, the 3-D data can be probed in an unbiased fashion, allowing the most important parameters of variation to be determined. Therefore, the engineer or designer does not need to assume that certain dimensions are more important than others and can rely on a purely data-driven approach.
Applications of this type of statistical shape analysis include optimizing implants to obtain better fit while maximizing population coverage, defining surfaces of plates in an optimal way, tweaking certain implants for certain demographics, and building entire product lines from the ground up, targeted toward the sub-populations. Existing implant sizes can be compared against shape models of new population groups (for example, Chinese or Indian demographics) to see where optimizations are required for these new markets. Note that the analysis also may reveal that the current sizing scheme would in fact work well in a new population of interest, potentially saving the cost of a total redesign.
Analyses of shapes already have led to the development of gender-specific knee implants and implants optimized for the Asian market.4 However, it must be noted that differences in populations based on ethnicity or gender are not the only reasons to analyze 3-D image data. Higher-order statistical analysis also may provide insights into healthy versus diseased anatomy. For example, bones of a certain shape may have a higher tendency to fracture, or show a certain wear pattern that allows earlier diagnosis and preventative action.
* * *
Anatomical data mining is the bridge between 3-D medical image data and the design space for standard implants, providing orthopedic designers and engineers with valuable parameters and population models to develop and optimize their products. Additional benefits include reduced time to market and a potential advantage with regulatory bodies in justifying design choices such as shapes and number of implant sizes. With increasing regulatory requirements on quality and lifetime of implants, and with emerging markets in the BRIC nations (Brazil, Russia, India and China) driving the growth in the orthopedic industry, population-based analysis, design and optimization of implants is likely to provide a competitive and marketing edge for companies that use such technology.
References:
Koen Engelborghs is the business unit director of Biomedical Engineering at Belgium-based Materialise, a provider of biomedical software solutions, consulting and additive manufacturing services. Koen has a master's degree in engineering and a Ph.D. cum laude in applied mathematics. Prior to his current role, he served in various roles at Materialise for 11 years, including research developer, product manager, research director, and technology and services director, leading to a broad awareness of the diverse applications and in-depth knowledge of technologies related to image-based biomedical engineering and biomedical applications of additive manufacturing.
Vinod Kaimal is the business development manager for the Biomedical Engineering business unit at Materialise. He obtained his Ph.D. in biomedical engineering with a focus in medical imaging and also holds a master’s degree in electrical engineering. He has co-authored multiple scientific papers, white papers and a book chapter, and has broad experience in biomedical engineering related to imaging and medical devices. In his current role, he is responsible for developing partnerships with medical device companies by providing advanced technological solutions. He can be reached via email at vinod.kaimal@materialise.com.
Anatomical data mining can improve the results for standard implant design.
Human beings are diverse in their physical makeup. Adult humans can range in height from under 4 feet to taller than 7 feet, and weigh less than 100 pounds to more than 500 pounds. Skeletal shapes also can vary tremendously, from outwardly visible differences (for example, varus/valgus deformation of the leg) to subtle differences in their shape (such as femur neck angle or femur head diameter). All this variation presents a challenge to design a well-fitting implant for the mass market. Take the example of a seat in a car. The seat is designed for a “standard person.” In the United States, the average male between 20 and 74 years of age is 5 feet, 9 and half inches tall and weighs 191 pounds.1 Automobile seats for the American market are designed, of course, keeping the average user in mind. Taller or smaller people can make themselves comfortable by making adjustments to the seat’s position—reclining, up or down, backward and forward. However, the further away from “average” a person is, the less optimal the seat is for that person. The same logic can be applied to orthopedic implants. While larger or smaller sizes are provided to address the diversity in the population, it is worth exploring the assumptions made in the design of those implants and the selection of sizes.
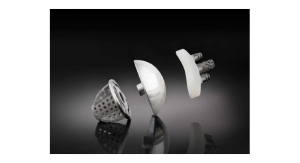
Figure 1: Who is the average patient? How does anatomy vary, not only with size but with gender or ethnic background? Answers to these questions can help optimize and develop better implants. |
Assumptions in Implant Design
While custom or semi-custom implants are now possible with craniomaxillofacial cases, extreme hip replacements and surgical instrumentation, most other orthopedic implants, such as knee or hip reconstructions, plates, nails, etc., still use standard, off-the-shelf implants. Implant designers, therefore, provide various sizes of implants based on some key measurements taken from the literature or a limited sampling of patient data. The different implant sizes often are scaled versions of the average implant, although, in reality, the shape of anatomy changes as a function of the size of the patient. In other words, the average small person is not just a scaled version of the average large person. In the case of knee implants, for example, the sizing of the implant commonly is determined entirely based on a single measurement—the antero-posterior (AP) dimension, with all other dimensions simply scaling with the AP measurement.
The implants are tested by manual fixation in a limited number of cadaver bones and optimized in a trial-and-error process, with feedback from surgeons, to find the optimal shape and position. Since the small set of cadavers does not necessarily describe the diversity in a population, there is a high possibility of a poor fit or even implant failure, especially in patients outside of the design space.
Several studies have now shown that implants designed based on assumptions that hold true for a certain demographic or ethnicity (e.g., male vs. female, Asian vs. European vs. North American), or body type (tall vs. short, lean vs. heavy) may not hold true in others. For example, authors of a recent study about the design of the femoral component in a total knee prosthesis in the Korean population found that the mediolateral (ML) dimension in a Korean population is larger compared with a Caucasian population.2 The study further shows that several implants currently on the Korean market that were designed based on measurements made in a Caucasian population have smaller ML dimensions for a given AP dimension, implying a poor fit (see Figure 2). Generally, some studies have shown that implants designed using data from a certain population may show poor fit and a higher failure rates in others.3
Figure 2: The resected distal femoral mediolateral and anteroposterior dimension in 100 knees of Korean females and males, compared with the six conventional femoral designs for total knee arthroplasty. The lines represent the average values for the female and male population. All the femoral designs showed mediolateral undersizing for matching AP dimensions. Reproduced with permission of publisher of Reference 2 as well as with permission from the authors. |
Measurements on populations
Today, with the increasing use of 3-D medical imaging technologies, specifically computed tomography (CT) and magnetic resonance imaging (MRI), combined with parallel developments in the application of advanced statistical methods, it is possible to analyze 3-D patient anatomy to extract features, trends and population-specific shape information. This can be applied to the development of new standard implants targeted to a specific population group, or to improve the shape of existing implants.
At the simplest level, measurements can be made on large numbers of image datasets to obtain a population’s mean dimensions. For example, obtaining the mean AP/ML dimension or the femur head diameter can provide a good starting point for implant design. Measurements that were made in two dimensions using X-ray radiographs about a decade ago now can be made in 3-D based on CT or MRI, with increased accuracy.
Advanced Measurements and Average Models
More advanced measurements such as the curvature of a bone canal, or the best fit sphere on a femur head now can be performed to obtain parameters that will be most suitable for a population. While custom implants are designed specifically for a patient using the patient’s own anatomy, a general implant can be designed using a “population average” model. Such a model can be obtained using hundreds of 3-D images by carefully segmenting out and building 3-D models of the anatomy of interest and defining landmarks to register these 3-D models together. The resultant population “average model” then can be used directly for design, enabling the engineer to design implants that should fit significantly better. (See Figure 3.)
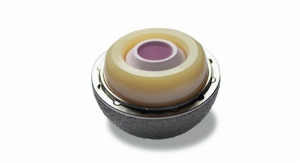
Figure 3: A population average model can be used as the starting point for optimizing an implant. For example, this tibial plate was designed using the tibial population average for a given size range. |
Statistical Models
Advanced statistical techniques can be used to further probe the 3-D datasets. Analysis of the entire geometrical shape is possible using principal component analysis that reduces high dimensional data into models that capture the variance in the dataset.3 The technique works on a vector representation of 3-D models. Mathematical operations on this training data set compress the information into an “average shape” and the principal modes of variance of that shape, i.e. the principal components.
Typically, the entire dataset can be represented by just a few independent modes, the ones that capture most of the inherent variation in the data. This average model, along with the modes of variance, essentially are an active shape model, which then can be analyzed and applied in several ways in the implant design process. For example, the implant can be designed based on the average and then evaluated against the extremes of the population in order to determine how well the implant covers the population.
Figure 4 shows the first mode or principal component, in the analysis of 40 Chinese femurs. The first mode is directly related to the length of the femur, but also captures with it any parameter that correlates with the length. In this case, the most visible correlation is the neck angle, which increases with length.
Figure 4: Variation of femur shape with size. The 3-D model in the center represents the population average. Notice how the femur neck angle varies across the population. The neck angle increases with a rise in femur length, indicative of the effect of changes in loading conditions on geometry as a function of size. (Data generated by Materialise using a dataset of 40 Chinese femur scans.) |
As with all statistical analyses, care must be taken to ensure that sufficient number of samples is included for the desired statistical power. It also is essential to ensure that the statistical model is indeed representative of the population of interest, by looking for and eliminating any bias in data selection, while removing outliers that may skew the data.
Applications
It is easy to see how specific measurements (angles, lengths, etc.) on a set of 3-D bone models can be useful in developing or optimizing implants. A better starting point for implant design is a statistical bone model, which could be used to optimize the shape, contours and size range of a variety of implants. Implants such as trauma plates or intramedullary nails can be better contoured and bent to follow the anatomy using these statistical bone models, thereby minimizing the amount of reshaping and trimming required during surgery. In addition to better fit, these bone models could lead to an optimized or “smart” sizing, allowing better coverage of the population with fewer sizes of implants.
The advantage of using more advanced statistical analyses resulting in complete 3-D models of averages and deviations, is that it can unravel hidden trends without pre-selection of specific measurements.
For example, a study on a dataset of 40 patients reveals that the femur neck angle has a correlation with length of the femur (See Figure 4). The larger neck angle seen in longer femurs could be a result of the differences in load experienced by the joint between shorter and taller people. By using methods such as principal component analysis, the 3-D data can be probed in an unbiased fashion, allowing the most important parameters of variation to be determined. Therefore, the engineer or designer does not need to assume that certain dimensions are more important than others and can rely on a purely data-driven approach.
Applications of this type of statistical shape analysis include optimizing implants to obtain better fit while maximizing population coverage, defining surfaces of plates in an optimal way, tweaking certain implants for certain demographics, and building entire product lines from the ground up, targeted toward the sub-populations. Existing implant sizes can be compared against shape models of new population groups (for example, Chinese or Indian demographics) to see where optimizations are required for these new markets. Note that the analysis also may reveal that the current sizing scheme would in fact work well in a new population of interest, potentially saving the cost of a total redesign.
Analyses of shapes already have led to the development of gender-specific knee implants and implants optimized for the Asian market.4 However, it must be noted that differences in populations based on ethnicity or gender are not the only reasons to analyze 3-D image data. Higher-order statistical analysis also may provide insights into healthy versus diseased anatomy. For example, bones of a certain shape may have a higher tendency to fracture, or show a certain wear pattern that allows earlier diagnosis and preventative action.
* * *
Anatomical data mining is the bridge between 3-D medical image data and the design space for standard implants, providing orthopedic designers and engineers with valuable parameters and population models to develop and optimize their products. Additional benefits include reduced time to market and a potential advantage with regulatory bodies in justifying design choices such as shapes and number of implant sizes. With increasing regulatory requirements on quality and lifetime of implants, and with emerging markets in the BRIC nations (Brazil, Russia, India and China) driving the growth in the orthopedic industry, population-based analysis, design and optimization of implants is likely to provide a competitive and marketing edge for companies that use such technology.
References:
- Ogden CL, Fryar CD, Carroll MD, Flegal KM. Mean body weight, height, and body mass index, United States 1960–2002. Advance data from vital and health statistics; no. 347 Hyattsville, Maryland: National Center for Health Statistics, 2004.
- Kwak D, Han S, Han CW, Han S. Resected femoral anthropometry for design of the femoral component of the total knee prosthesis in a Korean population, Anat Cell Biol. 43(3): 252–259, September 2010.
- Ho, W., Cheng, C., & Liau, J., Morphometrical Measurements of Resected Surface of Femurs in Chinese Knees: Correlation to the Sizing of Current Femoral Implants, The Knee, 13 (1), 12-14, 2006.
- Dunteman, G.H., Principal Components Analysis. Sage Publications, Newbury Park, 1989.
- Plaster RL, Starkman KB, McGee J, The Gender Solutions Natural-Knee Flex System and Future Directions, Am J Orthop. 2010;39(6 suppl):9-12, June 2010.
Koen Engelborghs is the business unit director of Biomedical Engineering at Belgium-based Materialise, a provider of biomedical software solutions, consulting and additive manufacturing services. Koen has a master's degree in engineering and a Ph.D. cum laude in applied mathematics. Prior to his current role, he served in various roles at Materialise for 11 years, including research developer, product manager, research director, and technology and services director, leading to a broad awareness of the diverse applications and in-depth knowledge of technologies related to image-based biomedical engineering and biomedical applications of additive manufacturing.
Vinod Kaimal is the business development manager for the Biomedical Engineering business unit at Materialise. He obtained his Ph.D. in biomedical engineering with a focus in medical imaging and also holds a master’s degree in electrical engineering. He has co-authored multiple scientific papers, white papers and a book chapter, and has broad experience in biomedical engineering related to imaging and medical devices. In his current role, he is responsible for developing partnerships with medical device companies by providing advanced technological solutions. He can be reached via email at vinod.kaimal@materialise.com.