
Jack Wieland, Project Manager, Lowell Inc.09.14.21
Lowell’s manufacturing team needed to start making a customer’s part on a new machine. The newer mill/turn machine was automated and would save a lot of machining time versus the original milling machine, but it required reprogramming the part.
To confirm the new process wouldn’t impact product results, the team performed several process qualification activities. They ran three lots of 30 parts each, then measured and analyzed the data of specific features. The results proved the new process was at least as capable as the previous manufacturing method.
This type of process qualification is a critical step for contract manufacturers to build OEM confidence in the manufacturing process. It’s a detailed analysis of raw data to prove a manufacturer can create the medical device or component consistently, even over multiple purchase orders and lots.
Often, the effort of process qualification is manual and tedious. Column after column of data needs to be copied and pasted into a software program, upper and lower specs are manually typed in, and a specific series of clicks must be followed to graph the data appropriately. This becomes increasingly time consuming—and opens greater opportunity for error—as the raw data grow.
Shifting to automated data analysis for process qualification activities can improve the effort for manufacturers and their customers in several ways:
Process Validation
Automated data analysis can be created through scripts or macros that are applied to statistical software, such as JMP or Minitab. At Lowell, Minitab is used for statistical analysis of raw data. We’ve developed a custom macro called PQ-it (Figure 1) to help automate the data analysis for our internal processes and our OEM customers.
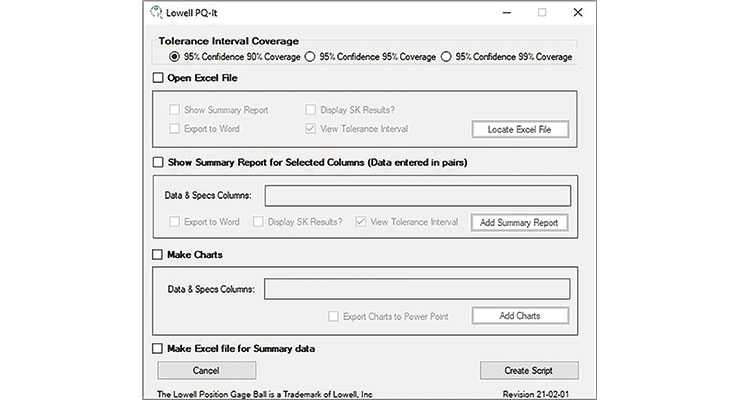
Figure 1: Lowell developed its PQ-it macro to save time on data analysis for process qualification.
Rather than go through the copy/paste exercise described previously, a script or a macro can allow a user to run detailed analysis on multiple columns of raw data all at once, then generate graphs to present to the customer (Table 1). This can lead to significant time savings depending on the number of data points. It also reduces the risk of error in carrying data over from a spreadsheet to the software program.
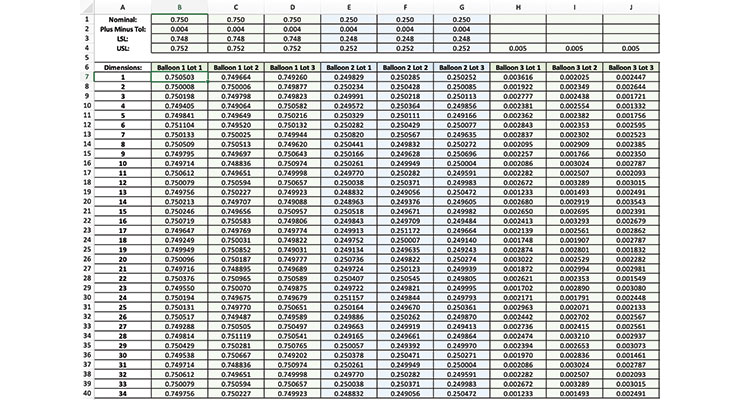
Table 1: Raw data as illustrated in this table needs to be analyzed as part of process qualification. Designing a script or macro for data analysis in statistical software programs can simplify the process and lead to time savings.
Once the data are analyzed, charts can be generated for use with customers. In some cases, analysis can be done and presented to the customer in the same day, accelerating turnaround time and leading to improved customer satisfaction.
Time Savings
Developing a script or macro is likely to be an internal effort, and it’s important to have buy-in and belief it is worth the effort.
As you consider investing resources toward automation, time savings is an important business and customer benefit.
For example, imagine a part has six features to measure and inspect. For process qualification, three lots of 34 parts each are manufactured and inspected. That generates 102 points of data to analyze for each feature.
Each data point needs to be analyzed against lower and upper spec limits, and meet the success criteria given by the customer.
In this instance, it may take 18.5 minutes for an analyst to copy/paste the inspection data into software, add spec limits, and run the required tests to generate graphs. Automating this analysis can reduce time invested by 17 minutes, or 92.9 percent.
As the number of features grow, so too can the time savings. In one internal study, there was a 98.2 percent time savings—or five hours and 12 minutes—on a part with 100 features. That gives the data analyst back more than half a day to dedicate to other work (Table 2).
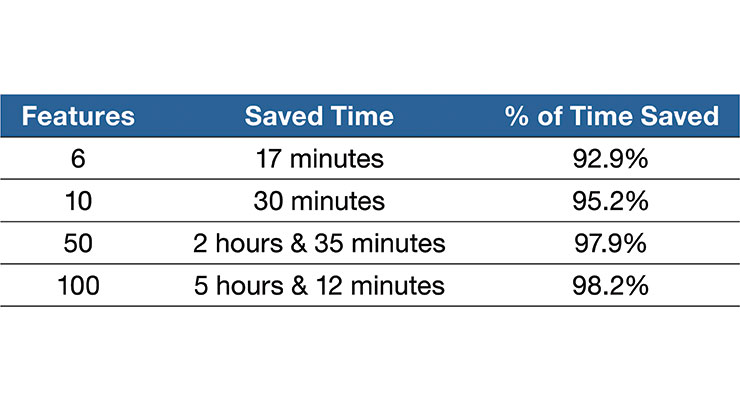
Table 2: This table shows the estimated time savings Lowell saw in automated vs. manual data analysis for process validation.
These time savings would also apply to OEM teams that analyze raw data provided by suppliers. An additional benefit for OEMs is standardizing how results are reported across statisticians and suppliers for smoother internal communications.
Realizing Benefits
Process qualification activities are often a requirement for OEMs working with contract manufacturers. Automated data analysis is a tool these manufacturers can use to improve turnaround times and analysis accuracy.
By understanding how macros or scripts can support your business goals, it’s possible to craft a solution that builds OEM confidence in your process, while decreasing the effort it takes for your team to analyze results.
Jack Wieland is a project manager at Lowell and currently manages Lowell’s New Product Introduction team. He holds a bachelor’s degree in chemical engineering from the University of Minnesota Duluth and a master’s degree in manufacturing engineering from the University of St. Thomas. Since he started at Lowell in 2017, Wieland has worked on several key projects, including the development and validation of a statistical analysis macro for Minitab as well as migrating Lowell’s entire quality management system to a software solution. Wieland is a certified ISO 13485:2016 lead auditor and is currently pursuing a Project Management Professional certification from the Project Management Institute.
To confirm the new process wouldn’t impact product results, the team performed several process qualification activities. They ran three lots of 30 parts each, then measured and analyzed the data of specific features. The results proved the new process was at least as capable as the previous manufacturing method.
This type of process qualification is a critical step for contract manufacturers to build OEM confidence in the manufacturing process. It’s a detailed analysis of raw data to prove a manufacturer can create the medical device or component consistently, even over multiple purchase orders and lots.
Often, the effort of process qualification is manual and tedious. Column after column of data needs to be copied and pasted into a software program, upper and lower specs are manually typed in, and a specific series of clicks must be followed to graph the data appropriately. This becomes increasingly time consuming—and opens greater opportunity for error—as the raw data grow.
Shifting to automated data analysis for process qualification activities can improve the effort for manufacturers and their customers in several ways:
- Improving accuracy: Automation removes the manual, repeated copy/paste exercise, which can increase the risk of errors.
- Reducing time: Automation can more quickly analyze raw data, up to 98.2 percent faster than manual processes.
- Increasing customer confidence: OEMs understand their supplier’s process can consistently deliver the needed results.
- Standardizing reporting format: Automation eliminates the need to hunt for the location of critical charts and graphs.
Process Validation
Automated data analysis can be created through scripts or macros that are applied to statistical software, such as JMP or Minitab. At Lowell, Minitab is used for statistical analysis of raw data. We’ve developed a custom macro called PQ-it (Figure 1) to help automate the data analysis for our internal processes and our OEM customers.
Figure 1: Lowell developed its PQ-it macro to save time on data analysis for process qualification.
Rather than go through the copy/paste exercise described previously, a script or a macro can allow a user to run detailed analysis on multiple columns of raw data all at once, then generate graphs to present to the customer (Table 1). This can lead to significant time savings depending on the number of data points. It also reduces the risk of error in carrying data over from a spreadsheet to the software program.
Table 1: Raw data as illustrated in this table needs to be analyzed as part of process qualification. Designing a script or macro for data analysis in statistical software programs can simplify the process and lead to time savings.
Once the data are analyzed, charts can be generated for use with customers. In some cases, analysis can be done and presented to the customer in the same day, accelerating turnaround time and leading to improved customer satisfaction.
Time Savings
Developing a script or macro is likely to be an internal effort, and it’s important to have buy-in and belief it is worth the effort.
As you consider investing resources toward automation, time savings is an important business and customer benefit.
For example, imagine a part has six features to measure and inspect. For process qualification, three lots of 34 parts each are manufactured and inspected. That generates 102 points of data to analyze for each feature.
Each data point needs to be analyzed against lower and upper spec limits, and meet the success criteria given by the customer.
In this instance, it may take 18.5 minutes for an analyst to copy/paste the inspection data into software, add spec limits, and run the required tests to generate graphs. Automating this analysis can reduce time invested by 17 minutes, or 92.9 percent.
As the number of features grow, so too can the time savings. In one internal study, there was a 98.2 percent time savings—or five hours and 12 minutes—on a part with 100 features. That gives the data analyst back more than half a day to dedicate to other work (Table 2).
Table 2: This table shows the estimated time savings Lowell saw in automated vs. manual data analysis for process validation.
These time savings would also apply to OEM teams that analyze raw data provided by suppliers. An additional benefit for OEMs is standardizing how results are reported across statisticians and suppliers for smoother internal communications.
Realizing Benefits
Process qualification activities are often a requirement for OEMs working with contract manufacturers. Automated data analysis is a tool these manufacturers can use to improve turnaround times and analysis accuracy.
By understanding how macros or scripts can support your business goals, it’s possible to craft a solution that builds OEM confidence in your process, while decreasing the effort it takes for your team to analyze results.
Jack Wieland is a project manager at Lowell and currently manages Lowell’s New Product Introduction team. He holds a bachelor’s degree in chemical engineering from the University of Minnesota Duluth and a master’s degree in manufacturing engineering from the University of St. Thomas. Since he started at Lowell in 2017, Wieland has worked on several key projects, including the development and validation of a statistical analysis macro for Minitab as well as migrating Lowell’s entire quality management system to a software solution. Wieland is a certified ISO 13485:2016 lead auditor and is currently pursuing a Project Management Professional certification from the Project Management Institute.
