Jack Wieland , Project Manager, Lowell Inc.09.16.22
The idea of reducing inspection costs is a face-off between two different priorities.
Priority one is budget. OEMs look for ways to reduce production costs where possible, and inspection is a seemingly good area because it can be a significant portion of a production budget.
Priority two is managing risk. Inspection requirements are designed to reduce risk and create confidence in the manufacturing process. If you reduce the level of inspection, it may create greater uncertainty over whether a product conforms to requirements or not.
This leaves companies in a predicament: can you reduce inspection costs without also increasing uncertainty? In certain cases, the answer is yes.
OEMs can work with contract manufacturers (CMs) to reduce inspection costs without increasing uncertainty in their manufacturer’s data and results. This is true when CMs have robust measurement systems and analytics in place and are able to use statistical methods to reduce inspection costs for OEMs.
This article will highlight three statistical methods that can help CMs and OEMs work together to reduce inspection time. It will also share two specific use cases where this approach can be a fit—if you have high receiving inspection costs or if you don’t have internal inspection capabilities.
For some OEMs, this means more is better. They may require 100% inspection, even on a validated manufacturing process. Others rely on AQL sampling charts to guide their requirements. In both cases, contract manufacturers have to determine the best methods and equipment to meet OEM requirements on a project-by-project basis.
There are three main statistical methods that, when used together, allow contract manufacturers to reduce inspection costs for OEMs.
Statistical process control (SPC): This demonstrates the manufacturer uses statistics to control processes on the manufacturing floor. When a manufacturing process is in a validated state, SPC on the manufacturing floor can give OEMs confidence the process is stable and in control.
Inspection correlation: This process uses statistical techniques to correlate the way a contract manufacturer measures a device with the way an OEM measures it. Measurement data from the contract manufacturer and the OEM are statistically analyzed to show if they correlate to each other. If the two inspection systems are found to be correlated and matched, the OEM can potentially use the contract manufacturer’s data as its own.
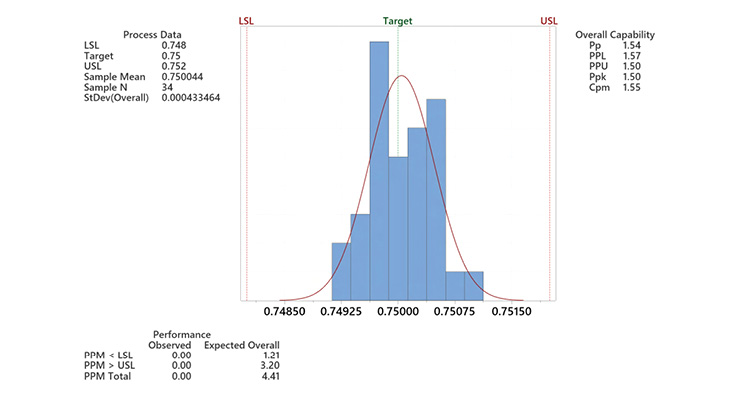
Process capability (Cpk): This number is used to indicate how capable a process is and can be used to reference AQL sampling charts for how many parts to inspect in a batch. Contract manufacturers determine Cpk by running statistical tests on inspection data. It’s common to complete 100% inspection on the first several runs of a part to establish Cpk and have a good record of historical data.
Many OEMs and manufacturers can benefit from looking at their processes to see how these statistical methods can help reduce inspection costs. Two main use cases we’ve seen are with OEMs that have a full receiving inspection team, and with OEMs that have no in-house inspection capabilities.
This is what happened for one of our customers. Our teams worked closely on inspection correlation so the customer could remove their requirements for receiving inspection. This was possible by using an array of statistical methods—I-MR charts for finding the error variance ratio between inspection systems; fitted line plots to check for correlation; and orthogonal regression, paired t-tests, and equivalence tests. The results allowed the customer to go dock-to-stock using our inspection results, saving them a large amount of time and resources at receiving inspection.
The industry standard Cpk is 1.33. But when historical data shows Cpk values of 3, 5, or in some cases, upwards of 10, for example, that indicates a highly capable process with limited variation—and an opportunity to reduce the level of inspection frequency. You can adjust your requirements and maintain your confidence in your partner’s inspection process.
This is what happened with one customer. There were 100% inspection requirements for features that historical inspection data showed had Cpk values greater than 10. When a process is that capable, 100% inspection shouldn’t be required.
We worked with the customer and presented data showing why inspection could be reduced. We put SPC in place on the process to give the customer confidence in the long-term stability of the process. For this specific instance, we agreed to reduce inspection from 100% of all parts to 100% of the first and last parts in 500-piece lots. That reduced inspection time by more than 99% for the features.
Jack Wieland is a project manager at Lowell and currently manages Lowell’s New Product Introduction team. He holds a bachelor’s degree in chemical engineering from the University of Minnesota Duluth and a master’s degree in manufacturing engineering from the University of St. Thomas. Since he started at Lowell in 2017, Wieland has worked on several key projects, including the development and validation of a statistical analysis macro for Minitab as well as migrating Lowell’s entire quality management system to a software solution. Wieland is a certified ISO 13485:2016 lead auditor and is currently pursuing a Project Management Professional certification from the Project Management Institute.
Priority one is budget. OEMs look for ways to reduce production costs where possible, and inspection is a seemingly good area because it can be a significant portion of a production budget.
Priority two is managing risk. Inspection requirements are designed to reduce risk and create confidence in the manufacturing process. If you reduce the level of inspection, it may create greater uncertainty over whether a product conforms to requirements or not.
This leaves companies in a predicament: can you reduce inspection costs without also increasing uncertainty? In certain cases, the answer is yes.
OEMs can work with contract manufacturers (CMs) to reduce inspection costs without increasing uncertainty in their manufacturer’s data and results. This is true when CMs have robust measurement systems and analytics in place and are able to use statistical methods to reduce inspection costs for OEMs.
This article will highlight three statistical methods that can help CMs and OEMs work together to reduce inspection time. It will also share two specific use cases where this approach can be a fit—if you have high receiving inspection costs or if you don’t have internal inspection capabilities.
The Statistical Methods
Before it’s possible to drive down inspection costs, we need to understand why a medical device’s inspection costs run high. Inspection costs are often driven by time and complexity, which in part are dictated by OEM and regulatory requirements. Each company sets its own inspection requirements based on risk. There is no industry standard, which means there is no agreed-upon set of rules or guidance that applies to all companies and suppliers.For some OEMs, this means more is better. They may require 100% inspection, even on a validated manufacturing process. Others rely on AQL sampling charts to guide their requirements. In both cases, contract manufacturers have to determine the best methods and equipment to meet OEM requirements on a project-by-project basis.
There are three main statistical methods that, when used together, allow contract manufacturers to reduce inspection costs for OEMs.
Statistical process control (SPC): This demonstrates the manufacturer uses statistics to control processes on the manufacturing floor. When a manufacturing process is in a validated state, SPC on the manufacturing floor can give OEMs confidence the process is stable and in control.
Inspection correlation: This process uses statistical techniques to correlate the way a contract manufacturer measures a device with the way an OEM measures it. Measurement data from the contract manufacturer and the OEM are statistically analyzed to show if they correlate to each other. If the two inspection systems are found to be correlated and matched, the OEM can potentially use the contract manufacturer’s data as its own.
Process capability (Cpk): This number is used to indicate how capable a process is and can be used to reference AQL sampling charts for how many parts to inspect in a batch. Contract manufacturers determine Cpk by running statistical tests on inspection data. It’s common to complete 100% inspection on the first several runs of a part to establish Cpk and have a good record of historical data.
Many OEMs and manufacturers can benefit from looking at their processes to see how these statistical methods can help reduce inspection costs. Two main use cases we’ve seen are with OEMs that have a full receiving inspection team, and with OEMs that have no in-house inspection capabilities.
Use Case #1: High Receiving Inspection Costs
For OEMs with high receiving inspection costs, statistical methods can help shift the burden of inspection away from your employees and back to your contract manufacturer. This is possible if your supplier has historical data on the device or component, and a good track record of excellent lot acceptance rates for parts they’ve made for you in the past. For example, you’ve worked with a manufacturer who’s provided 100 percent lot acceptance rates over the past year. In this scenario, there’s proof your partner can make the part in spec and meet your expectations because:- Their manufacturing processes are in a validated state.
- All critical features on the part have established Cpk values >1.33.
- They have SPC in place.
- Your inspection processes correlate.
- Your team confirms their inspection results.
This is what happened for one of our customers. Our teams worked closely on inspection correlation so the customer could remove their requirements for receiving inspection. This was possible by using an array of statistical methods—I-MR charts for finding the error variance ratio between inspection systems; fitted line plots to check for correlation; and orthogonal regression, paired t-tests, and equivalence tests. The results allowed the customer to go dock-to-stock using our inspection results, saving them a large amount of time and resources at receiving inspection.
Use Case #2: No Internal Inspection Capabilities
For OEMs without internal inspection capabilities, the same statistical methods can be applied to reduce costs. Where the benefits are realized, however, is different from the first use case. Instead of reducing receiving inspection costs, you may be able to reduce the level of inspection required by the contract manufacturer, and therefore reduce the cost of inspection without reducing your confidence in the results. For this to be true, certain pieces must be in place:- Your supplier has historical data on the device or component because they have made it before.
- Your supplier has a track record of excellent lot acceptance rates for the part.
- You’ve reviewed their validation of the manufacturing process.
- You’ve reviewed their on-floor SPC.
The industry standard Cpk is 1.33. But when historical data shows Cpk values of 3, 5, or in some cases, upwards of 10, for example, that indicates a highly capable process with limited variation—and an opportunity to reduce the level of inspection frequency. You can adjust your requirements and maintain your confidence in your partner’s inspection process.
This is what happened with one customer. There were 100% inspection requirements for features that historical inspection data showed had Cpk values greater than 10. When a process is that capable, 100% inspection shouldn’t be required.
We worked with the customer and presented data showing why inspection could be reduced. We put SPC in place on the process to give the customer confidence in the long-term stability of the process. For this specific instance, we agreed to reduce inspection from 100% of all parts to 100% of the first and last parts in 500-piece lots. That reduced inspection time by more than 99% for the features.
Conclusion
Reducing inspection costs doesn’t have to be at odds with managing risk but it does require a calculated approach. With the right manufacturing partner and the appropriate statistical methods, it’s possible for OEMs to reduce the cost of inspection for their medical devices without creating uncertainty.Jack Wieland is a project manager at Lowell and currently manages Lowell’s New Product Introduction team. He holds a bachelor’s degree in chemical engineering from the University of Minnesota Duluth and a master’s degree in manufacturing engineering from the University of St. Thomas. Since he started at Lowell in 2017, Wieland has worked on several key projects, including the development and validation of a statistical analysis macro for Minitab as well as migrating Lowell’s entire quality management system to a software solution. Wieland is a certified ISO 13485:2016 lead auditor and is currently pursuing a Project Management Professional certification from the Project Management Institute.
